Capital Region Market Stats
These are sample charts from stale data. Please sign up to access real time interactive and advanced reports.
Key Indicators/Metrics

Monthly Market Stats

Year-To-Date Statistics
Current as of publication date.
Top Producing Companies/Brokerages

Time Lapse of Brokerages Leader-Board by Volume($)
Time Lapse for YTD Brokerage Leaderboard by $ Volume
Properties Status as of Publication Date:

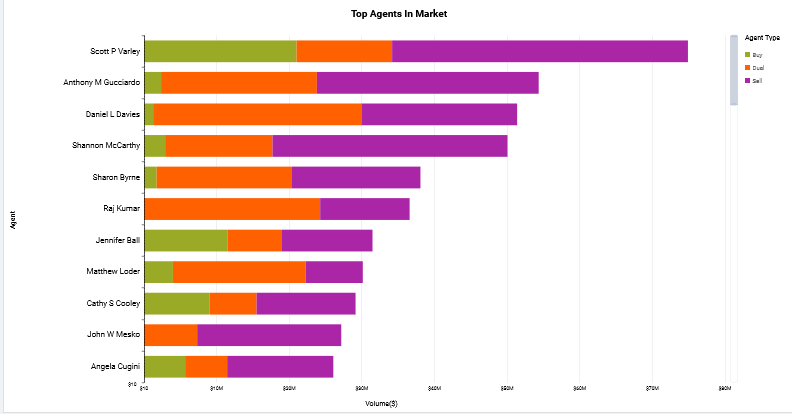
Top Producing Agents:

Last 12 Months Stats
Inventory and forecast

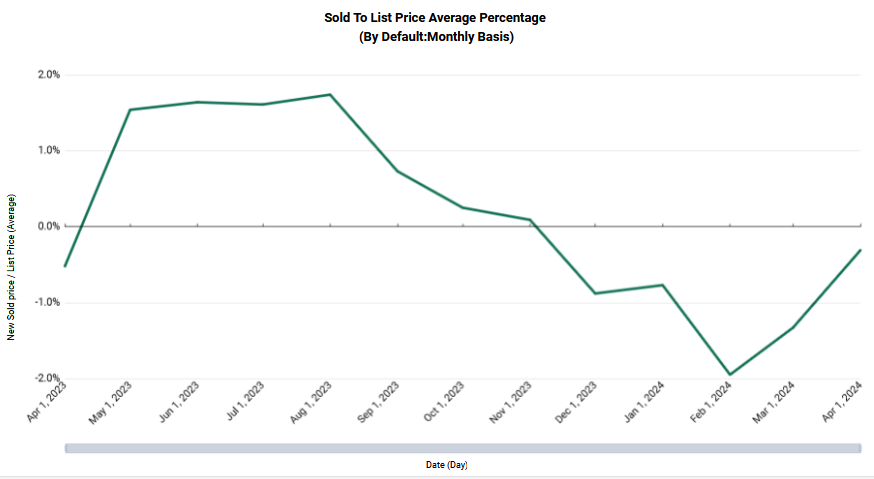
Average Monthly Sold-to-List Price Ratio:

YOY Comparison
Average Number of Active listings Daily:

Number of Sold Properties:

Volume($) of Closed Properties:

Average Days from List to Pending:

Disclaimer: Content provided here is deemed reliable but not guaranteed. Charts use multiple data sources and is subject to data subscription agreement between Bhumio and the data providing entity (such as MLS, 3rd part real estate data feed etc.). All analytics is limited to residential, Multifamily and Land real estate data as available in our data sources and we also make certain assumptions for missing data (e.g. commission splits, operational expenses of a brokerage). All Charts, visuals, analysis and analytics are property of Bhumio Inc. By viewing this page you agree to terms and conditions, and privacy policy of Bhumio Inc. Do not copy, reproduce, distribute, publish, display, perform, modify, create derivative works, transmit, or in any other way exploit any part of copyrighted material without written permission from Bhumio. Inc.
